 Mass on a Spring
Resource:
The Science Reasoning Center: Mass on a Spring
Grade Level: High School
Description:
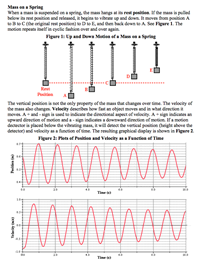
This passage describes the up and down motion of a mass on a spring using a diagram, a position-time graph, and a velocity-time graph. Questions target a student's ability to select values from a graph, to combine information from two different graphs to draw appropriate conclusions, to identify the amplitude and the period, and to interpret the graphs in light of information on a diagram.
This activity aligns with the three dimensions of the Next Generation Science Standards in the manner described below:
| Patterns: Empirical evidence is needed to identify patterns. |
As a mass oscillates on a spring, its position and velocity form a sinusoidal pattern when graphed as a function of time. While this up and down motion is familiar to all, it is the graphing of empirical data that yields the richness of this periodic function. This passage explores these patterns. At an even deeper level, students will come to understand the relationships between these graphs. When the mass’s position is at a maximum or minimum, for example, the velocity is zero; when the mass moves through its equilibrium position, the speed is a maximum. These are just two several ‘hidden’ relationships that can be uncovered through careful study of the graphs presented in this passage. |
| Energy and Matter: Within a natural or designed system, the transfer of energy drives the motion and/or cycling of matter. |
While this passage explores a mass on a spring system from a kinematics perspective, undergirding such motion is the concept of energy conservation. As there is a continual exchange between kinetic and potential energies, we see that this transfer of energy drives the motion and cycling of the mass. This is a simple yet helpful physical system that models the cycling of matter which occurs in many other systems through the science disciplines. |
| Analyzing and Interpreting Data: Analyze data using tools, technologies, and/or models (e.g., computational, mathematical) in order to make valid and reliable scientific claims or determine an optimal design solution. |
Many physics classes use motion detector connected to a computer to graph the position and velocity of an object as a function of time. This passage describes how such a tool was used to collect data for an oscillating mass on a spring. The questions at the end of the passage ask students to use the provided diagram along with a position versus time graph and velocity versus time graph to identify the mass location under specified conditions, to identify the amplitude and the period of oscillation, and to draw other appropriate conclusions. |
Associated Reading from The Physics Classroom
Other Supporting Pages at The Physics Classroom:
View Infographic.
(Coming Soon)
Search the NGSS Corner
Maybe you're looking for something really specific that pertains to a desired topic and emphasizes one or more of the listed NGSS dimensions. Why not try a search of this section of our website? Simply select from one or more of the pull-down menus and click Search This page will reload and a collection of possibilities will be displayed in this section of the page and sorted by relevancy.