Physics of Roller Coasters - Complete Toolkit
Objectives
- To use energy principles and energy bar charts to explain the changes in speed of a car that traverses a roller coaster track.
- To use kinetic and potential energy equations to predict the speed of a roller coaster car at a particular height on the track if given the initial height of the first drop.
- To construct free-body diagrams for riders along curved sections of the track (dips and hills, banked turns, , loop tops, and loop bottoms) and to explain the relative magnitudes of the individual forces at such locations along the track.
- To use the concepts of inertia and centripetal force to explain the sensations that riders have along curved sections of a roller coaster track.
- To use circular motion equations and Newton's second law to mathematically analyze curved sections of the track, relating the rider speed, radius of curvature, mass, and individual force values to one another.
Readings from The Physics Classroom Tutorial
Interactive Simulations
- Roller Coaster Model
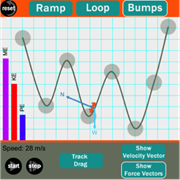 This interactive simulation allows students to explore energy and forces associated with the motion of a roller coaster car. The model window represents the forces (Fgrav and Fnorm) the velocity by vector arrows and represents kinetic energy, potential energy, and the total mechanical energy by bar charts. The speed of the car at each position along the track is indicated by a digital display. Students can explore a straight-line inclined plane, a loop and a section of track with a series of hills and dips. The last two explorations include the ability to modify the shape of the loop or of the hills and dips.
- Roller Coaster Design
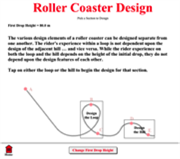 The Roller Coaster Design Interactive provides an engaging walk-through of the variables that affect the thrill and safety of a roller coaster design. Factors affecting speed, accelerations, normal force and the number of Gs are presented in an understandable language. Students then design a loop top, a loop bottom, a hill top, and a hill bottom and view how design parameters such as heights and radii affect the experience and safety of the riders. The Interactive comes with two different activities. One activity is designed to support classrooms that are using the Interactive as part of a roller coaster design activity. The second activity has been designed to support classrooms that are using the Interactive to promote science reasoning skills.
- Open Source Physics: Roller Coaster Model and Lesson Plan
 This Java model created by a high school teacher simulates motion along a constrained path and lets students explore numerous concepts associated with roller coaster physics: conservation of energy, reaction forces, and friction. Choose from 5 track configurations or create your own. Energy bar graphs show changing levels of kinetic/potential energy. You can set initial speed or add friction. Don’t miss the lesson plan and student guide! Oh….you can easily access the source code to set your own parameters
- PhET Energy Skate Park
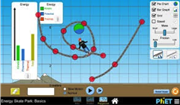 If your classroom computers are Java enabled, this popular PhET simulation provides a robust environment to explore conservation of energy in skateboarding. Though it’s not a roller coaster system, many design issues are similar to those faced by ride designers. You can build ramps, jumps, and loops. You can add friction, change the rider’s mass, and view kinetic, potential, and thermal energy in bar graphs or pie charts. We especially like the auto-generated Energy vs. Position graphs and the tool to change gravitational constant. What would the motion be like on Jupiter or the moon?
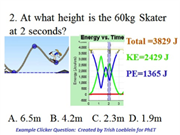 Teachers: Don’t miss the set of 35 Power Point slides that go with the “Energy Skate Park” simulation -- Veteran HS physics teacher Trish Loeblein created a great set of clicker questions to gauge student understanding of conservation of energy concepts. Includes questions AND answer key about skating ramps and roller coasters.
Video and Animations
- PBS Learning Media: Centripetal Force in a Roller Coaster
 This 5-minute video does a remarkably good job of explaining why you feel a sensation of being thrown outward from the center during a loop-the-loop, even though there is no outward net force. It will help students differentiate centripetal acceleration from the fictitious “centrifugal force”.
- National Geographic Megafactories – Extreme Roller Coaster Documentary
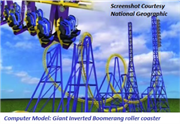 This 45-minute video could be a great choice for a flipped lesson. It takes viewers into the world of roller coaster megafactory Vekoma Rides in the Netherlands, where the extreme “Giant Inverted Boomerang” roller coaster is made. It will give students a deeper insight into the full engineering design process, from initial concept through R&D and Autocad modeling, and concluding with supervision of construction. It will help underscore the importance of computational modeling that integrates the physics.
- Energy Transformation of a Roller Coaster
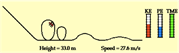 This GIF animation uses energy bar charts and a digital display to depict changes in kinetic energy and potential energy as a roller coaster car moves along the track. Height and speed values are displayed as well. The animation is accompanied by a short written discussion of the principles underlying the transformation of energy from potential to kinetic forms.
- Roller Coaster G Forces
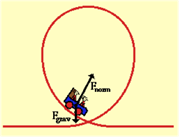 This GIF animation from The Physics Classroom portrays the direction and relative magnitude of the individual forces acting upon a roller coaster car in a clothoid loop. The animation is accompanied by an explanation of the connection between the force magnitudes and the sensations of weightlessness and weightiness that a rider feels at various locations within a coaster loop.
Labs and Investigations
- The Physics Classroom, The Laboratory, Energy on an Incline Plane
Students analyze the motion of a cart rolling up and done an inclined track using motion detectors. They quickly realize that while the form of energy (KE, PE) is changing, the total amount of these two forms remain constant.
- The Physics Classroom, The Laboratory, Energy of a Pendulum
Students use a photogate and accessory gate to analyze the energy associated with a swinging pendulum. They observe that energy changes form from potential energy to kinetic energy while the sum of these two forms remains approximately constant.
- The Physics Classroom, The Laboratory, Making the Turn
Students make observations of the law of inertia for an object that fails to make a turn and of the centripetal force that is required in order for an object to successful make a turn.
- The Physics Classroom, The Laboratory, Loop the Loop
Students swing a partially-filled bucket of water in a loop and observe the relative tension in the string that pulls it inward. They use free-body diagrams and Newton's second law to relate the strength of this force to the acceleration..
Links:
http://www.physicsclassroom.com/lab/index.html#energy
http://www.physicsclassroom.com/lab/index.html#circ
Experiments and Investigations
- TeachEngineering: Energy on a Roller Coaster
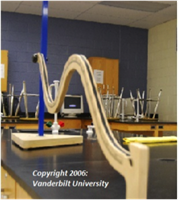 This investigation for Grades 9-12 calls for data collection with a PhotoGate device to accurately measure the position of a marble as it rolls down a track. It was created by the Vanderbilt School of Engineering for the award-winning TeachEngineering website. The lesson aims to promote understanding of conservation of energy in a system, and gives students practice in creating/interpreting data from an Excel graph of Position vs. Energy. Includes standards-aligned lesson plan, pre-and-post assessments, and student guide.
- WIRED Physics: G-Forces in a Looping Water Slide
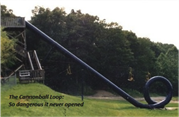 Professor/blogger Rhett Allain brings us another engaging physics problem inspired by an incredibly dangerous design. In this segment of Wired Physics, Dr. Allain uses math to investigate the question of why we don’t build amusement park loops in a fully circular configuration. Be sure your students first read about this insane water slide (link embedded in the activity), which has to be one of the most flagrantly bad designs in theme park history. Dr. Allain shows you how to calculate the g-forces on an unlucky rider. He sets 0.2 as coefficient of friction – (water slides are more slippery than roller coasters), then he explains a shortcut to calculating the radial velocity around the loop.
- Roller Coaster Building Contest: AAPT and Six Flags America
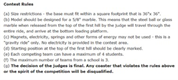 Did you know that the American Association of Physics Teachers partners with Six Flags Amusement Parks to offer a roller coaster design contest? It’s divided into two levels: Grades 5-8 and Grades 9-12. Students win points for 3 components: technical merit, creativity, and excitement factor. Rules were revised in 2015 – contestants are limited to “gravity ride” construction (no magnets, electricity, or springs). HAVE FUN!
Minds On Physics Internet Modules:
The Minds On Physics Internet Modules are a collection of interactive questioning modules that target a student’s conceptual understanding. Each question is accompanied by detailed help that addresses the various components of the question.
- Work and Energy module, Ass’t WE3 - Kinetic and Potential Energy
- Work and Energy module, Ass’t WE4 - Total Mechanical Energy
- Work and Energy module, Ass’t WE6 - Work-Energy Bar Chart Analysis
- Work and Energy module, Ass’t WE8 - Energy Conservation - Math Analysis
- Circular Motion module, Ass’t CG3 - Centripetal Force and Inertia
- Circular Motion module, Ass’t CG4 - Centripetal Force Requirement
- Circular Motion module, Ass’t CG5 - Mathematical Analysis of Circular Motion
Concept Building Exercises:
- The Curriculum Corner, Work, Energy and Power, Energy
- The Curriculum Corner, Work, Energy and Power, Energy Concepts
- The Curriculum Corner, Work, Energy and Power, Work-Energy Bar Charts
- The Curriculum Corner, Circular Motion, Circular Motion and Inertia
- The Curriculum Corner, Circular Motion, Centripetal Force Requirement
- The Curriculum Corner, Circular Motion, Mathematics of Circular Motion
Links:
http://www.physicsclassroom.com/curriculum/energy
http://www.physicsclassroom.com/curriculum/circles
Problem-Solving Exercises:
- The Calculator Pad, Work, Energy and Power, Problems #12 - #18
- The Calculator Pad, Circular Motion and Gravitation, Problems #1 - #15
Links:
http://www.physicsclassroom.com/calcpad/energy/problems
http://www.physicsclassroom.com/calcpad/circgrav/problems
Science Reasoning Activities:
- The Science Reasoning Center – Circular Motion Section - Weightlessness Training
- The Science Reasoning Center – Circular Motion Section - Roller Coaster Loops
Link: http://www.physicsclassroom.com/reasoning/circularmotion
Real Life Connections:
- A Century of Screams – Multimedia History of the Roller Coaster (PBS)
 Did you know there were 1500+ roller coasters in the U.S. by the late-1920’s? The introduction of electric winches to pull cars up a hill transformed roller coasters into “scream machines” with steeper drops, tighter curves and dizzying speeds. But some of these retro wooden coasters were so dangerous they frequently resulted in injury or even fatality. Roller coasters fell out of favor in the 1930’s. Walt Disney is credited with reviving the roller coaster with the Matterhorn ride built at Disneyland in 1959 – the first tubular steel roller coaster in the world. This resource from PBS gives a great overview of roller coaster history and a glimpse of the early technologies.
- Roller Coaster Safety: Accident Analysis
 Don’t forget about the study of system failure – it’s an important part of the engineering process and often overlooked in high school physics. Early roller coaster designs (see resource above) experienced failure mostly due to flawed track design, unsafe initial velocities, or untrained ride operators. WHAT ABOUT NOW? The Physics Classroom took a dive into roller coaster disasters in the past decade. We learned that a surprising number of accidents were due to failures in passenger restraint systems or collisions caused by stalled cars.
THE TASK: Watch the videos below about two catastrophic roller coaster accidents – one in June 2015 that involved a collision, and one in 2013 involving a failed passenger seat belt. Both roller coasters were designed by Gerstlauer Amusement Rides of Germany. Conduct a web quest to find out what caused the failures and build an argument about who should be held liable – the manufacturer, the theme park, or perhaps the rider(s)? Teachers: this will not be a simple task for students and will require more than a Google search. This will be a test of their internet mining skills and their ability to assess an accident within the context of engineering design.
Video 1: BBC News – Smiler Roller Coaster Crash, June 201
http://www.bbc.com/news/uk-england-stoke-staffordshire-32987550
Video 2: Fox News – Deadly Fall from “Texas Giant” Roller Coaster, July 2013
http://www.fox4news.com/story/22889634/six-flags-woman-died-while-riding-texas-giant
Supplement: Fort Worth Star Telegram – Battle over Liability in Texas Giant Fatality
http://www.star-telegram.com/news/business/article3865021.html
Common Misconceptions:
- The Thrill is in the Speed
Students often falsely believe that the thrill of a roller coaster ride is due to how fast riders move. While speed may be a contributor to rider thrill, it is not the sole contributor. In fact, speed by itself does not lead to any sense of thrill. Many amusement park goers move faster on their trip down the highway to the amusement park than they move once they arrive at the park. If thrill were due to speed along, such thrill-seekers should continue driving on the highway and save themselves some money. The thrill of a ride is associated with changes in speed and direction. It is these changes that lead to accelerations and the changes in seat force that make amusement park rides so exciting. The thrill comes from accelerations and rapid changes in accelerations and the associated changes in the normal forces experienced by riders.
Standards:
A. Next Generation Science Standards (NGSS)
Performance Expectations – Forces and Interactions
- HS-PS2-1 Analyze data to support the claim that Newton’s second law of motion describes the mathematical relationship among the net force on a macroscopic object, its mass, and its acceleration.
Performance Expectations – Physical Science: Energy
- HS-PS3-1 Create a computational model to calculate the change in the energy of one component in a system when the change in energy of the other component(s) and energy flows in and out of the system are known.
Disciplinary Core Ideas – Motion and Stability: Forces and Interactions
- HS-PS2.A.i Newton’s Second Law accurately predicts changes in the motion of macroscopic objects.
- HS-PS2.A.ii Momentum is defined for a particular frame of reference; it is the mass times the velocity of the object.
Disciplinary Core Ideas – Physical Science: Energy – Conservation of Energy/EnergyTransfer
- HS-PS3.B.i Conservation of energy means that the total change of energy in any system is always equal to the total energy transferred into or out of the system.
- HSPS3.B.iii Mathematical expressions, which quantify how the stored energy in a system depends on its configuration and how kinetic energy depends on mass and speed, allow the concept of conservation of energy to be used to predict and describe system behavior
Crosscutting Concepts
Cause and Effect
- High School: Systems can be designed to cause a desired effect.
Systems and System Models
- High School: When investigating or describing a system, the boundaries and initial conditions of the system need to be defined.
- High School: Models can be used to predict the behavior of a system, but these predictions have limited precision and reliability due to the assumptions and approximations inherent in models.
- High School: Models (e.g. physical, mathematical, computer models) can be used to simulate systems and interactions – including energy, matter, and information flows – within and between systems at different scales.
Energy and Matter
- High School: Changes of energy and matter in a system can be described in terms of energy and matter flows into, out of , and within that system.
- High School: Energy cannot be created or destroyed – it only moves between one place and another place, between objects and/or fields, or between systems.
Structure and Function
- High School: Investigating or designing new systems or structures requires a detailed examination of the properties of different materials, the structures of different compounds, and connections of components to reveal its function and/or solve a problem.
Science and Engineering Practices
Practice #1 – Analyzing and Interpreting Data
- High School: Analyze data using tools, technologies, and/or models (e.g., computational, mathematical) in order to make valid and reliable scientific claims or determine an optimal design solution.
Practice #2 – Developing and Using Models
- High School: Develop and use a model based on evidence to illustrate the relationships between systems or between components of a system.
- High School: Use a model to predict relationships between components of a system.
Practice #3 – Planning and Carrying Out Investigations
- High School: Plan and conduct an investigation individually and collaboratively to produce data to serve as the basis for evidence, and in the design: decide on types, how much, and accuracy of data needed to produce reliable measurements and consider limitations on the precision of the data (e.g., number of trials, cost, risk, time), and refine the design accordingly.
Practice #4 – Using Mathematics and Computational Thinking
- High School: Create or revise a computational model or simulation of a phenomenon, designed device, process, or system.
- High School: Use mathematical and/or computational representations of phenomena or design solutions to support explanations.
Practice #5 – Constructing Explanations and Designing Solutions
- High School: Apply scientific ideas to solve a design problem, taking into account possible unanticipated effects.
- High School: Construct and revise an explanation based on valid and reliable evidence obtained from a variety of sources (including students' own investigations, models, theories, simulations, peer review) and the assumption that theories and laws that describe the natural world operate today as they did in the past and will continue to do so in the future.
Practice #6 – Obtaining, Evaluating, and Communicating Information
- High School: Communicate scientific and technical information (e.g. about the process of development and the design and performance of a proposed process or system) in multiple formats (including graphically and mathematically).
B. Common Core Standards for Mathematics (CC) – Grades 9-12
Standards for Mathematical Practice:
- MP.1 - Make sense of problems and persevere in solving them.
- MP.2 - Reason abstractly and quantitatively
- MP.4 - Model with mathematics
High School Algebra: Seeing Structure in Expressions
- A-SSE.1.a - Interpret parts of an expression, such as terms, factors, and coefficients
- A-SSE.2 - Use the structure of an expression to identify ways to rewrite it.
High School Algebra: Creating Equations
- A-CED.2 - Create equations in two or more variables to represent relationships between quantities, graph equations on coordinate axes with labels and scales
- A-CED.4 Rearrange formulas to highlight a quantity of interest, using the same reasoning as in solving equations
High School Functions: Trigonometric Functions
- F-TF.1 - Understand radian measure of an angle as the length of the arc on the unit circle subtended by the angle
High School Functions: Linear, Quadratic, and Exponential Models
- F-LE.5 - Interpret the parameters in a linear or exponential function in terms of a context
High School Functions: Interpreting Functions
- F-IF-4 - For a function that models a relationship between two quantities, interpret key features of graphs and table in terms of the quantities, and sketch graphs showing key features given a verbal description of the relationship.
C. Common Core Standards for English/Language Arts (ELA) – Grades 9-12
Reading Standards: Science and Technical Subjects – Key Ideas and Details
- RST.11-12.2 - Determine the central ideas or conclusions of a text; summarize complex concepts, processes, or information presented in a text by paraphrasing them in simpler but still accurate terms.
- RST.11-12.3 - Follow precisely a complex multistep procedure when carrying out experiments, taking measurements, or performing technical tasks; analyze the specific results based on explanations in the text.
Science and Technical Subjects – Integration of Knowledge and Ideas
- RST.11-12.9 - Synthesize information from a range of sources (e.g., texts, experiments, simulations) into a coherent understanding of a process, phenomenon, or concept, resolving conflicting information when possible.
Science and Technical Subjects – Range of Reading and Level of Text Complexity
- RST.11-12.10 - By the end of grade 12, read and comprehend science/technical texts in the grades 11-CCR text complexity band independently and proficiently.