Hold down the T key for 3 seconds to activate the audio accessibility mode, at which point you can click the K key to pause and resume audio. Useful for the Check Your Understanding and See Answers.
 Lesson 1 of this unit of The Physics Classroom Tutorial focused on the nature of light as a wave. Evidence that led scientists to believe that light had a wavelike nature was presented. One piece of evidence centered around the ability of one light wave to interfere with another light wave. This interference is most obvious if monochromatic light from two coherent sources is allowed to interfere. In Lesson 3 of this unit, we will focus upon the mathematical nature of two-point source light interference. The relationship between the wavelength of light and the specific features of a two-point source interference pattern will be described. The means by which Thomas Young used this relationship to measure the wavelength of light will be discussed.
In Lesson 1, the nature of the interference pattern produced by two bobbing sources in a ripple tank (water tank) was discussed. 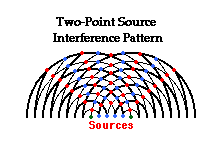 The diagram at the right depicts the pattern resulting from the propagation of water waves across the surface of the water. The waves propagate outward from the point sources, forming a series of concentric circles about the source. In the diagram, the thick lines represent wave crests and the thin lines represent wave troughs. The crests and troughs from the two sources interfere with each other at a regular rate to produce nodes (pictured in blue on the diagram) and antinodes (pictured in red) along the water surface. The nodal positions are locations where the water is undisturbed; the antinodal positions are locations where the water is undergoing maximum disturbances above and below the surrounding water level. One unique feature of the two-point source interference pattern is that the antinodal and nodal positions all lie along distinct lines. Each line can be described as a relatively straight hyperbola. The spatial separation between the antinodal and nodal lines in the pattern is related to the wavelength of the waves. The mathematical relationship will be explored later in this lesson. For now, we will investigate the underlying causes of this unique pattern and introduce some nomenclature (naming conventions) that will be utilized throughout the lesson.
The animation below shows a series of concentric circles about two point sources (labeled as S1 and S2). The pattern could be the result of water waves in a ripple tank resulting from two vibrating sources; or the result of sound waves from two speakers traveling through a room; or the result of two light waves moving through a room after passing through two slits or pinholes in a sheet of paper. Like the diagram above, the thick lines represent wave crests and the thin lines represent wave troughs. The red dots in the animation represent the antinodal positions; the blue dots represent the nodal positions. The red lines drawn through the antinodal points (red dots) are referred to as antinodal lines and the blue lines drawn through the nodal points (blue dots) are referred to as nodal lines.
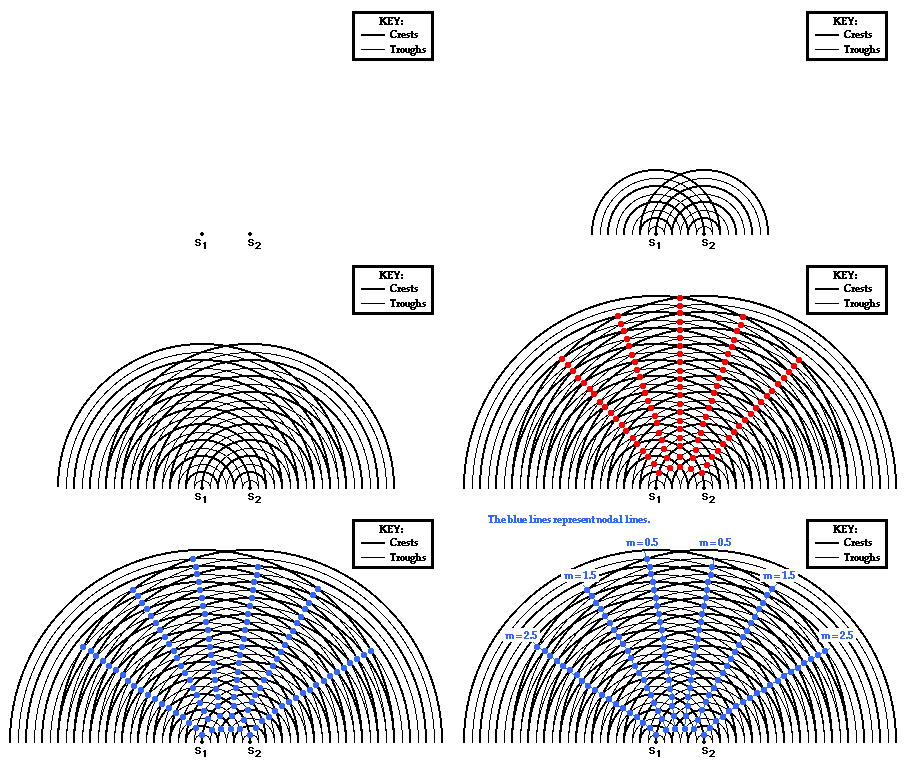
A naming and numbering system is used to refer to these antinodal and nodal lines. An antinodal line extends outward from the sources in the exact center of the pattern. This antinodal line is referred to as the central antinodal line. More antinodal lines are present to the left and to the right of the central antinodal line. These are referred to as the first antinodal line, the second antinodal line, the third antinodal line (if present), etc. Each antinodal line is separated by a nodal line. The nodal lines are also named; the first nodal line to the left or to the right of the central antinodal line is referred to as the first nodal line. The second nodal line and the third nodal line are found as one moves further to the left and to the right of the center of the pattern.
Each line in the pattern is assigned a number, known as the order number and represented by the letter m. The numbering system associated with this pattern is just as creative as the naming system. The central antinodal line is assigned an order number of 0. The first antinodal line is assigned an order number of 1; the second antinodal line is assigned an order number of 2; the third antinodal line is assigned an order number of 3; etc. Nodal lines are assigned half-numbers. The first nodal line, located between the central antinodal line (m = 0) and the first antinodal line (m = 1) is assigned the order number of 0.5. The second nodal line, located between the first antinodal line (m = 1) and the second antinodal line (m = 2) is assigned the order number of 1.5. Finally, the third nodal line, located between the second antinodal line (m = 2) and the third antinodal line (m = 3) is assigned the order number of 2.5. Subsequently, if one were to start in the center of the pattern and observe the lines (both antinodal and nodal) and associated numbers to the left or to the right of the central antinodal line, the numbers would start at 0 and increase by one-half:
0  0.5
0.5  1
1  1.5
1.5  2
2  2.5
2.5  etc.
etc.
Each whole number is associated with an antinodal line and each half-number is associated with a nodal line. (The numbering and naming systems used here for nodal lines differs slightly from that used in many textbooks. The reason for the numbering system will be more clear after the next part of this lesson.)
Check Your Understanding
1. Observe the two-point source interference pattern shown below. Several points are marked and labeled with a letter.
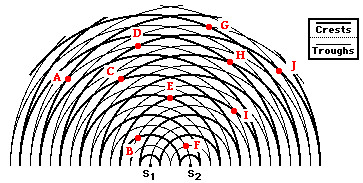
Which of the labeled points are ...
a. ... on nodal lines?
b. ... on antinodal lines?
c. ... formed as the result of constructive interference?
d. ... formed as the result of destructive interference?
2. Observe the two-point source interference pattern shown below. Several points are marked and labeled with a letter.
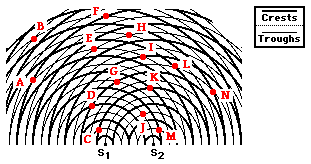
Which of the labeled points are ...
a. ... on the central antinodal line?
b. ... on the first antinodal line?
c. ... on the second antinodal line?
d. ... on the first nodal line?
e. ... on the second nodal line?
f. ... on the third nodal line?