Hold down the T key for 3 seconds to activate the audio accessibility mode, at which point you can click the K key to pause and resume audio. Useful for the Check Your Understanding and See Answers.
 Our study of 1-dimensional kinematics has been concerned with the multiple means by which the motion of objects can be represented. Such means include the use of words, the use of diagrams, the use of numbers, the use of equations, and the use of graphs. Lesson 4 focuses on the use of velocity versus time graphs to describe motion. As we will learn, the specific features of the motion of objects are demonstrated by the shape and the slope of the lines on a velocity vs. time graph. The first part of this lesson involves a study of the relationship between the shape of a v-t graph and the motion of the object.
Constant Velocity versus Changing Velocity
Consider a car moving with a constant, rightward (+) velocity - say of +10 m/s. As learned in an earlier lesson, a car moving with a constant velocity is a car with zero acceleration.
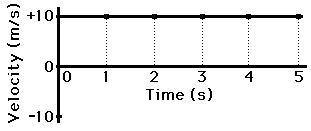 If the velocity-time data for such a car were graphed, then the resulting graph would look like the graph at the right. Note that a motion described as a constant, positive velocity results in a line of zero slope (a horizontal line has zero slope) when plotted as a velocity-time graph. Furthermore, only positive velocity values are plotted, corresponding to a motion with positive velocity.
Now consider a car moving with a rightward (+), changing velocity - that is, a car that is moving rightward but speeding up or accelerating. Since the car is moving in the positive direction and speeding up, the car is said to have a positive acceleration.
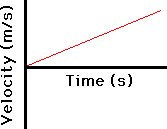
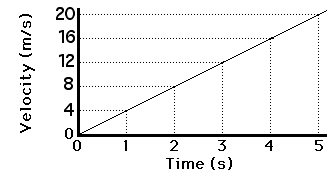 If the velocity-time data for such a car were graphed, then the resulting graph would look like the graph at the right. Note that a motion described as a changing, positive velocity results in a sloped line when plotted as a velocity-time graph. The slope of the line is positive, corresponding to the positive acceleration. Furthermore, only positive velocity values are plotted, corresponding to a motion with positive velocity.
The velocity vs. time graphs for the two types of motion - constant velocity and changing velocity (acceleration) - can be summarized as follows.
Positive Velocity
Zero Acceleration |
Positive Velocity
Positive Acceleration |
 |
 |
The Importance of Slope
 The shapes of the velocity vs. time graphs for these two basic types of motion - constant velocity motion and accelerated motion (i.e., changing velocity) - reveal an important principle. The principle is that the slope of the line on a velocity-time graph reveals useful information about the acceleration of the object. If the acceleration is zero, then the slope is zero (i.e., a horizontal line). If the acceleration is positive, then the slope is positive (i.e., an upward sloping line). If the acceleration is negative, then the slope is negative (i.e., a downward sloping line). This very principle can be extended to any conceivable motion.
The slope of a velocity-time graph reveals information about an object's acceleration. But how can one tell whether the object is moving in the positive direction (i.e., positive velocity) or in the negative direction (i.e., negative velocity)? And how can one tell if the object is speeding up or slowing down?
Positive Velocity versus Negative Velocity
The answers to these questions hinge on one's ability to read a graph. Since the graph is a velocity-time graph, the velocity would be positive whenever the line lies in the positive region (above the x-axis) of the graph. Similarly, the velocity would be negative whenever the line lies in the negative region (below the x-axis) of the graph. As learned in Lesson 1, a positive velocity means the object is moving in the positive direction; and a negative velocity means the object is moving in the negative direction. So one knows an object is moving in the positive direction if the line is located in the positive region of the graph (whether it is sloping up or sloping down). And one knows that an object is moving in the negative direction if the line is located in the negative region of the graph (whether it is sloping up or sloping down). And finally, if a line crosses over the x-axis from the positive region to the negative region of the graph (or vice versa), then the object has changed directions.

Speeding Up versus Slowing Down
 Now how can one tell if the object is speeding up or slowing down? Speeding up means that the magnitude (or numerical value) of the velocity is getting large. For instance, an object with a velocity changing from +3 m/s to + 9 m/s is speeding up. Similarly, an object with a velocity changing from -3 m/s to -9 m/s is also speeding up. In each case, the magnitude of the velocity (the number itself, not the sign or direction) is increasing; the speed is getting bigger. Given this fact, one would believe that an object is speeding up if the line on a velocity-time graph is changing from near the 0-velocity point to a location further away from the 0-velocity point. That is, if the line is getting further away from the x-axis (the 0-velocity point), then the object is speeding up. And conversely, if the line is approaching the x-axis, then the object is slowing down.

See Animations of Various Motions with Accompanying Graphs
Check Your Understanding
 1. Consider the graph at the right. The object whose motion is represented by this graph is ... (include all that are true):
- moving in the positive direction.
- moving with a constant velocity.
- moving with a negative velocity.
- slowing down.
- changing directions.
- speeding up.
- moving with a positive acceleration.
- moving with a constant acceleration.
We Would Like to Suggest ...

Sometimes it isn't enough to just read about it. You have to interact with it! And that's exactly what you do when you use one of The Physics Classroom's Interactives. We would like to suggest that you combine the reading of this page with the use of our
Graph That Motion or our
Graphs and Ramps Interactives. Each is found in the Physics Interactives section of our website and allows a learner to apply concepts of kinematic graphs (both position-time and velocity-time) to describe the motion of objects.